


See the value a CDP could add to your business
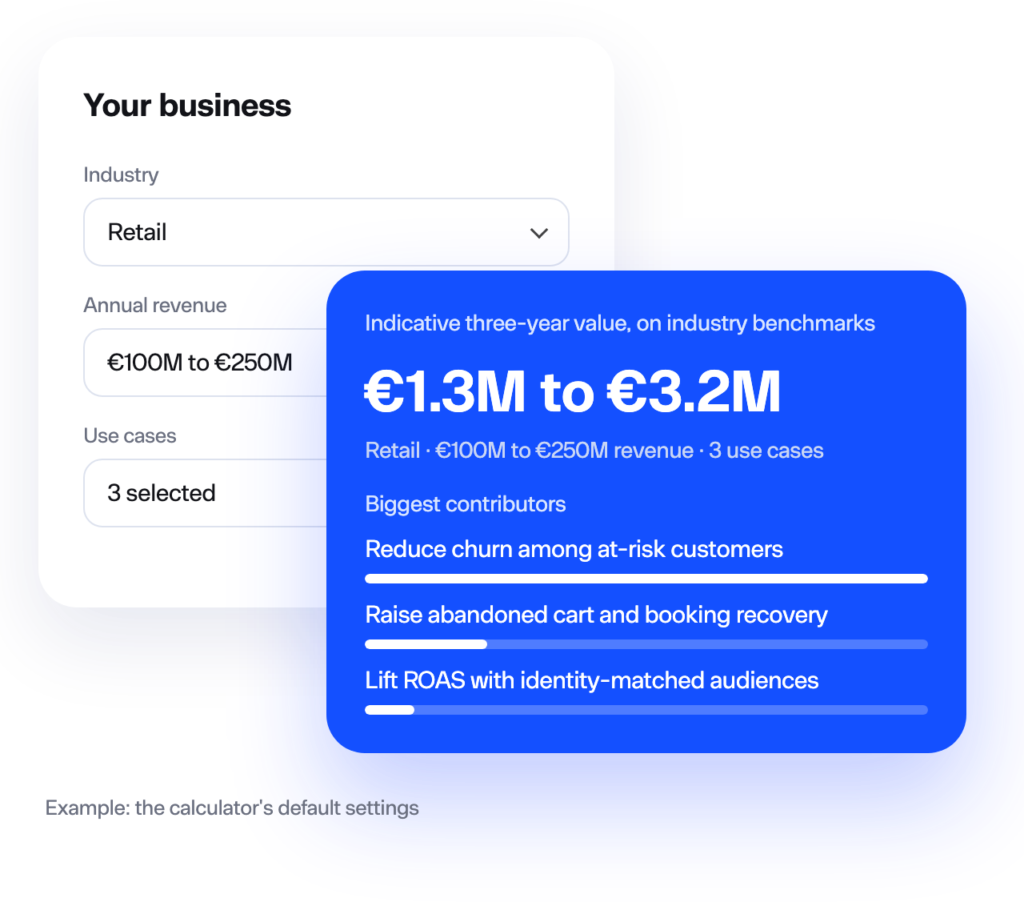
Your business
How the CDP value calculator works
It estimates the incremental revenue and media savings a customer data platform could add to your business over three years, from industry benchmarks for your sector and size.
- You give three answers: your industry, your annual revenue and the use cases to include.
- For each use case, the model applies industry benchmarks for your sector to a business of your size. There are 59 in all.
- Only the improvement counts. Zeotap is credited with between 45% and 100% of it, depending on how much your email, web and ad tools contribute.
- The low end of the range uses conservative benchmarks and the high end expected ones. The page never shows more than 3% of three years of revenue.
- Costs, such as licence and implementation, are not on this page. Your report covers them with your own figures.
What's behind this range 3 answers from you, 59 industry benchmarks and 8 model rules. Your report swaps the benchmarks for your figures and adds 19 more inputs, from your margins to your teams' time.
From you
- IndustryFrom you
- Annual revenueFrom you
- Use cases to includeFrom you
Your business
- Digital marketing spendIndustry benchmark
- Customer lifetime value, one-time buyersIndustry benchmark
- Customer lifetime value, repeat buyersIndustry benchmark
Your customers
- Known customersIndustry benchmark
- Unknown visitors and users per yearIndustry benchmark
- Churn rateIndustry benchmark
- Carts, leads or bookings per yearIndustry benchmark
- First-time buyers per yearIndustry benchmark
- New customers acquired per yearIndustry benchmark
Unit economics
- Average order, booking or lead valueIndustry benchmark
- Cross-sell valueIndustry benchmark
- Cost per acquisitionIndustry benchmark
- Return on ad spendIndustry benchmark
- Return on reallocated spendIndustry benchmark
- Target cost per acquisitionIndustry benchmark
Conversion funnel
- Abandonment rateIndustry benchmark
- Conversion rate, all visitorsIndustry benchmark
- Conversion rate, known customersIndustry benchmark
- Conversion rate, retargetingIndustry benchmark
- Conversion rate, abandonment recoveryIndustry benchmark
Email and push
- Emails sent per yearIndustry benchmark
- Email open rateIndustry benchmark
- Email click-through rateIndustry benchmark
- Email conversion rateIndustry benchmark
- Push notifications sent per yearIndustry benchmark
- Push click-through rateIndustry benchmark
- Push conversion rateIndustry benchmark
Use-case benchmarks
Lift ROAS with identity-matched audiences In your range
- Addressable paid-media audienceIndustry benchmark
- Match rate todayIndustry benchmark
- Match rate with ZeotapIndustry benchmark
- Conversion rate on new reachIndustry benchmark
- Adoption over timeIndustry benchmark
- Acquisition cost efficiencyIndustry benchmark
- Return on boosted spendIndustry benchmark
- Share of paid spend in scopeIndustry benchmark
Suppress existing customers from paid media In your range
- Paid-media audience per campaignIndustry benchmark
- Share of audience who are existing customersIndustry benchmark
- Ad frequencyIndustry benchmark
- Cost per thousand impressionsIndustry benchmark
- Effectiveness of suppression on wasted spendIndustry benchmark
- Campaigns per yearIndustry benchmark
- Operations hours saved per campaignIndustry benchmark
Raise abandoned cart and booking recovery In your range
- Recovery upliftIndustry benchmark
- Incentive cost per recovered cartIndustry benchmark
- Contact cost per recovery messageIndustry benchmark
Grow first-to-second purchase rate In your range
- Second-purchase rate todayIndustry benchmark
- Uplift from lifecycle journeysIndustry benchmark
- Window to a second purchaseIndustry benchmark
- Incentive cost per second purchaseIndustry benchmark
- Channel cost per first-time buyerIndustry benchmark
- Cannibalisation adjustmentIndustry benchmark
- Discount adjustmentIndustry benchmark
Cross-sell to high-propensity customers In your range
- Share of customers with cross-sell propensityIndustry benchmark
- Conversion uplift on cross-sell offersIndustry benchmark
Reduce churn among at-risk customers In your range
- Retention uplift for at-risk customersIndustry benchmark
- Channel cost per at-risk customer reachedIndustry benchmark
- Incentive cost per retained customerIndustry benchmark
Lift on-site conversion and AOV with personalisation In your range
- Conversion rate upliftIndustry benchmark
- Order value upliftIndustry benchmark
Raise email and push CTR and conversion In your range
Uses the email and push benchmarks above.
Model rules
- Three scenarios
- Conservative and expected cases are shown here. The upside case needs your own figures, so it is in your report.
- Three-year ramp
- Each use case delivers 25% of its full value in year one, 87.5% in year two and 100% in year three.
- Uplift only
- What your current programmes already achieve is excluded. Only the improvement counts.
- Zeotap's share
- Between 45% and 100% of each improvement, depending on how much your email, web and ad tools contribute. The rest is credited to them.
- Data maturity
- Assumed average here. Your report adjusts for how connected your data is today.
- Public ceiling
- This page never shows more than 3% of three years of revenue, whatever the inputs.
- Currency
- The model runs in euros. Other currencies are converted at fixed, approximate exchange rates.
- Revenue basis
- Value is shown as incremental revenue and media savings, before your margins. Your report can apply your own gross margin.
Added in your report
Your margins
- Gross profit marginIn your report
- EBITDA marginIn your report
Your teams
- Marketing headcountIn your report
- IT headcountIn your report
- Data headcountIn your report
- Analytics headcountIn your report
- Machine learning headcountIn your report
- Hourly cost, marketingIn your report
- Hourly cost, data and ITIn your report
- Hourly cost, legalIn your report
- Working hours per personIn your report
Time saved on manual data work
- Marketing time on manual data tasksIn your report
- Data and analytics time on manual data tasksIn your report
- IT time on data-platform supportIn your report
- Efficiency of your target setupIn your report
- Share of freed time put to useIn your report
Compliance risk
- Risk events per yearIn your report
- Likelihood of a regulatory consequenceIn your report
- Cost per consequenceIn your report
Every benchmark above can be swapped for your own figure. A specialist does that with you, and the result is your report.
Replace the benchmarks with your figures
What customers have done with Zeotap


Build your report on your own numbers.
Your range used industry benchmarks. A Zeotap specialist rebuilds it with your figures.
In 30 minutes, you get:
- Your own rangeBenchmarks swapped for your figures wherever you have them.
- Every use case, side by sideIncluding the ones you didn't select.
- The full calculationsEvery formula, input and benchmark behind each figure.
- An in-depth report you can shareCalculations and benchmarks included, sent after the session.
Trusted by




 FAQ
What this range can and can’t tell you
Each benchmark in the model is tagged by where it comes from: an industry benchmark for your sector and region, a result from Zeotap customer programmes, a figure customers reported in published case studies, or a stated assumption. Your report shows which applies to each figure.
No. What your current programmes already achieve is left out, and only the improvement counts. Zeotap gets between 45% and 100% of each improvement, depending on how much your email, web and ad tools contribute, and the rest is credited to them.
No. The calculator runs in your browser and does not save your answers.
The low end uses conservative benchmarks and the high end uses expected ones. The page also never shows more than 3% of three years of revenue, whatever you enter. Your own revenue, customer base and channel volumes replace the benchmarks in your report, which can move the range up or down.
In a 30-minute session, a specialist replaces the benchmarks with your own figures where you have them and sizes every use case, not only the ones you picked. You get your report afterwards to share internally.
Open “What’s behind this range” under the calculator to see every input and rule the model uses. To see the range on your own numbers, book a 30-minute session further down this page.
