Navigating a customer data platform (CDP) and ensuring its health at every turn is fundamental for campaign success. Every blind spot in your data sources is a potential disaster and full knowledge of your account’s usage is critical for understanding the effectiveness of the investment in a CDP adoption.
What cannot be measured, cannot be managed, so businesses cannot address issues that they simply cannot see. In order to achieve quality, efficiency and sustainability through your customer data, you must have a transparent view of its usage-related metrics to better understand the effectiveness of the CDP platform that you have invested in.
Zeotap CDP’s Usage feature was born to address exactly these challenges. As you read on you will learn about what it has to offer, all the challenges that it solves and how it can prove beneficial for your business needs.
An introduction to Zeotap CDP’s Usage feature
To give our customers clear visibility of their data usage within the Zeotap CDP platform, the Usage feature provides just the right amount of consumption metrics in the form of intuitive charts. The metrics include the number of individuals / customer profiles ingested and from which data sources (web / real-time vs CRM / batch, for example), the number of audience segments created and more.
A dashboard shows important usage metrics related to your account. Based on these metrics, you can better understand your exact usage of the platform and take corrective actions as required.
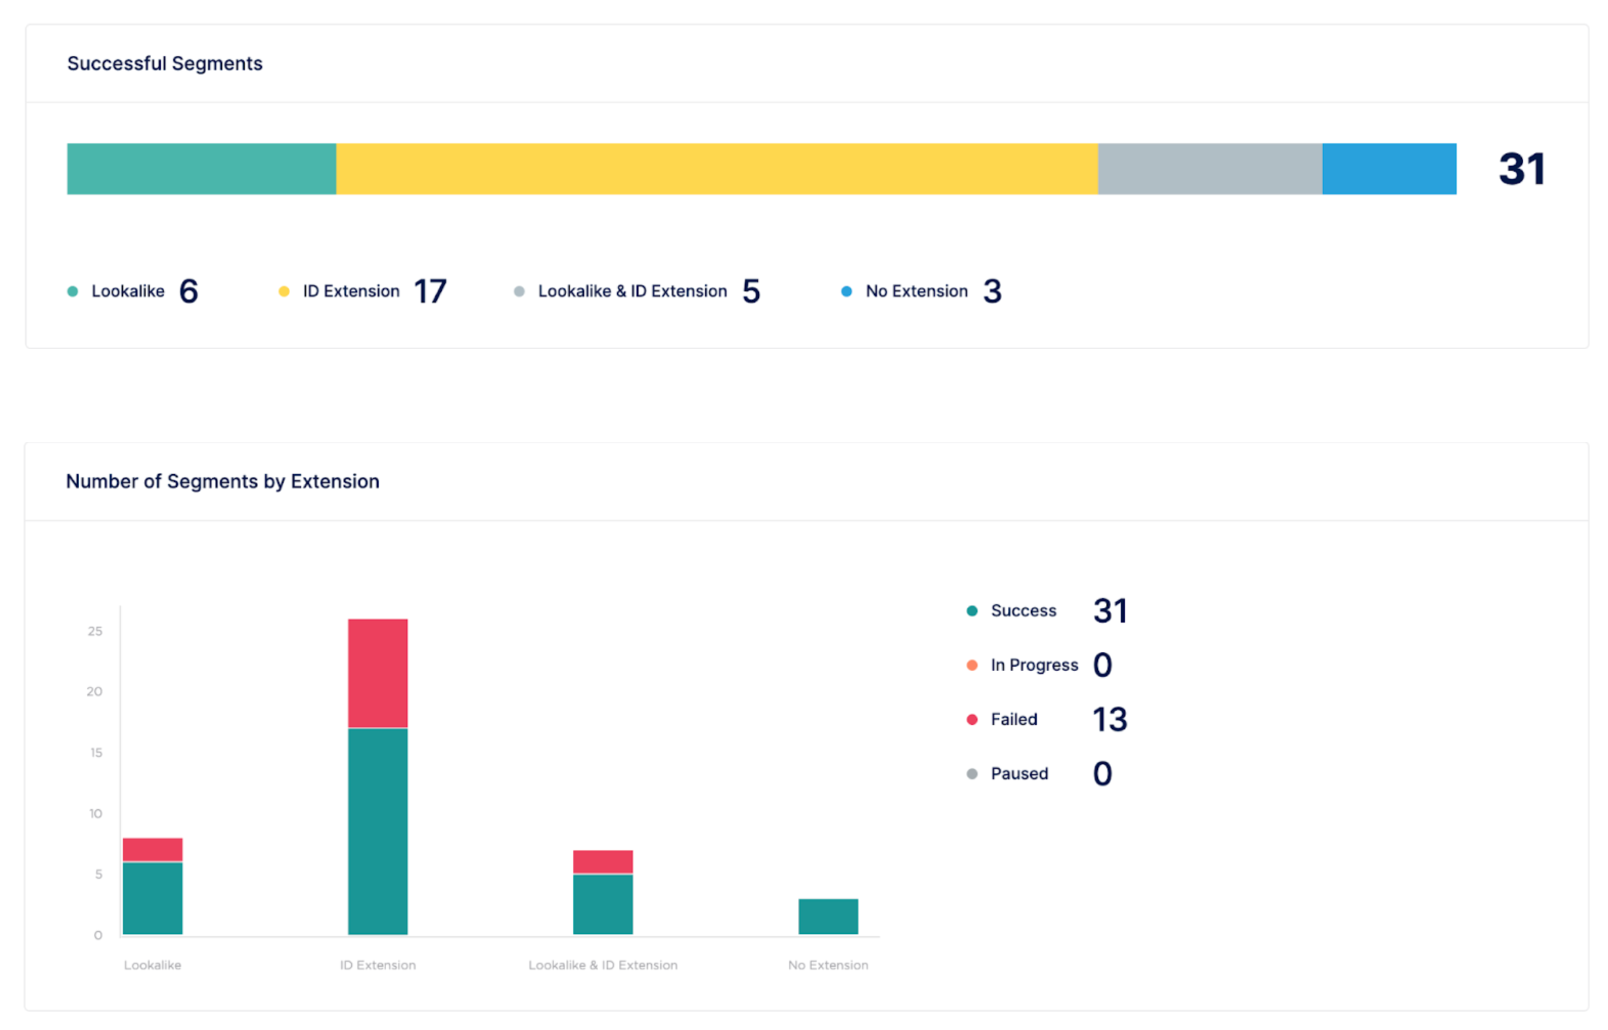
A screenshot of Zeotap CDP’s Usage feature:
Problems that the Usage feature solves
SaaS users require platform usage-related metrics to help figure out the effectiveness of the platform. Visualisations, in the form of intuitive charts, help to gauge if the adoption is as expected, especially when cross-referenced against the price of the platform. Without this feature, customers find it difficult to determine how well they are using the platform.
Key uses of Zeotap CDP’s Usage feature:
- See the health of the account at a glance – The Usage feature gives information about the state in which various segments are present and keeps a track of data ingestion over time. Both these metrics act as a good indicator of how well the Zeotap CDP platform is being used.
- Track consumption against pricing guardrails – Data points like the volume of data and the no. of individuals / customers, events ingested and the number of unique profiles present are important from a billing perspective. These are available as summary data points in the Usage feature, helping customers budget their consumption or allocate funds for upgrades / overages.
- Correlate with customer engagement on your website – You get to understand the breakdown of real-time vs. batched and CRM data. This helps you draw a comparison between the kind of website engagement that is expected and what you are actually experiencing.
Exciting capabilities to highlight
Here is a summary of the key capabilities that the Usage feature offers:
- Quick glance of summary metrics like the volume of data brought in, the no. of users, ingested events, number of unique user profiles, logins and more
- Breakdown of ingested data type and ingested volumes over time
- Consumption metrics for new features like Calculated Attributes and Journeys (our real-time journey orchestration workflow feature)
Watch this space for even more capabilities in the future…
- Metrics to help determine ROI from Zeotap CDP
- Channel and destination usage metrics
- Automatically set the time in charts to the beginning of the current contract period
Understanding the Usage feature through a use case
Meet Joe, head of marketing for a retail brand that uses Zeotap CDP. He is assigned administrative responsibilities to monitor the usage of the CDP platform. Here is how Joe’s responsibilities are divided; Joe has 5 assistant marketing managers who drive the marketing for the 5 main verticals of the retail brand.
Each of the 5 marketing managers makes the most use of Zeotap CDP’s Source Analytics feature for
- Complete visibility of the data sources and customer records ingested
- Faster identification and resolution of ingestion-related issues
and Segment Lifecycle feature that powers the Segment Status Display use case by tracking, recording and displaying segment events over time.
These two offerings are capable of driving improvements in time-to-campaign as well as the actionability of marketing.
Joe wants to check on the following:
- If his managers have been using the platform frequently
- If the website traffic has had a shift post-launch of new marketing campaign
- If his assistant managers are creating new campaigns on a regular basis and pausing old ones
With Zeotap CDP’s Usage module in place, Joe can have a high-level view of how his team is using the CDP platform in just a couple of clicks. It is important for Joe to be on top of these details to audit the effectiveness of the CDP.
If you’re interested in learning more about how Zeotap CDP’s Usage feature can help your business, you can request a demo here. We’d be happy to answer any questions you have.
